README
react-time-heatmap
Show a heatmap based on the time of day for several days
😎 Demo: https://react-time-heatmap.netlify.app/
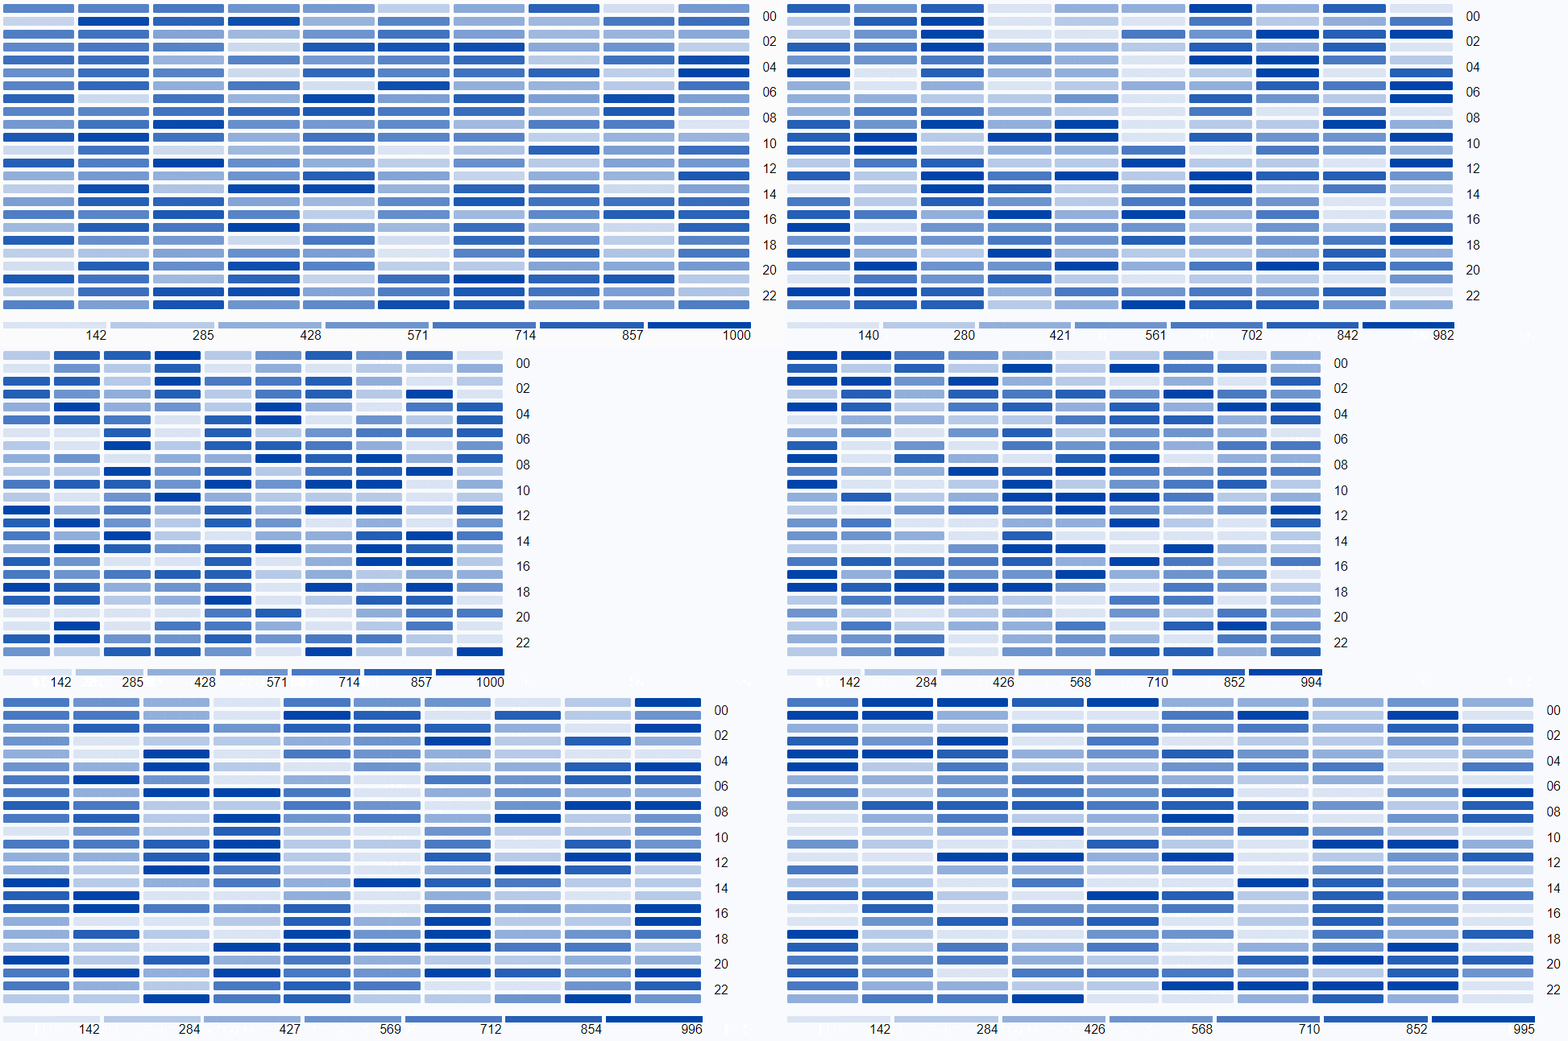
The component takes time entries and displays the count as a heatmap.
✔ add entries for an unlimited number of days
✔ select the number of groups/levels to show in colours (light blue to dark blue)
✔ can be made to flow and use all the space it has, responsively
✔ has no dependencies
Install
npm i --save react-time-heatmap
Import
import { ITimeEntry, TimeHeatMap } from "react-time-heatmap";
Examples
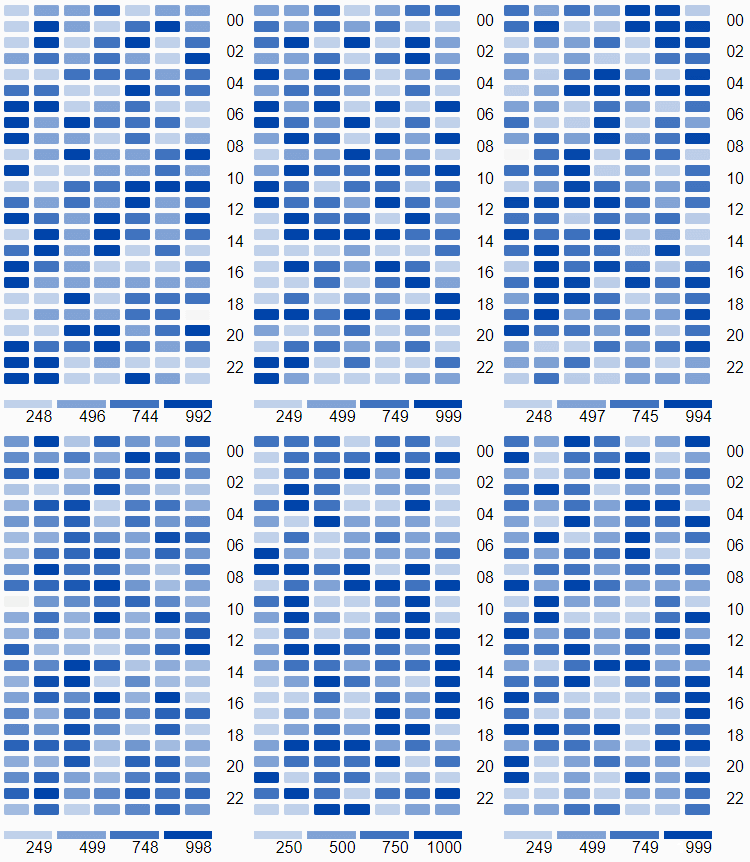
Shows entries
<TimeHeatMap timeEntries={entries} />
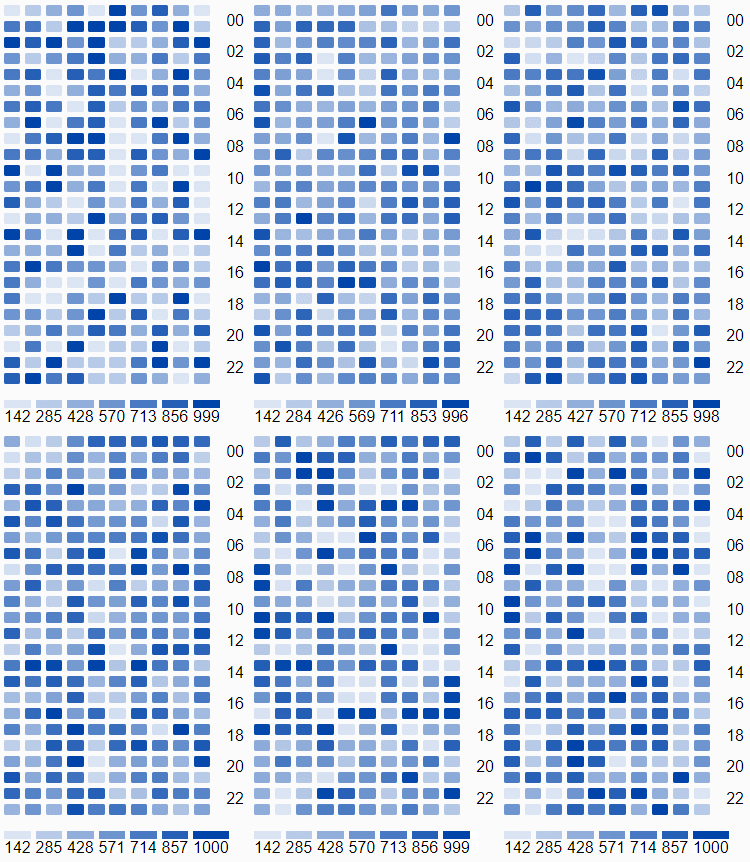
Shows entries into a custom number of groups
<TimeHeatMap timeEntries={entries} numberOfGroups={7} />
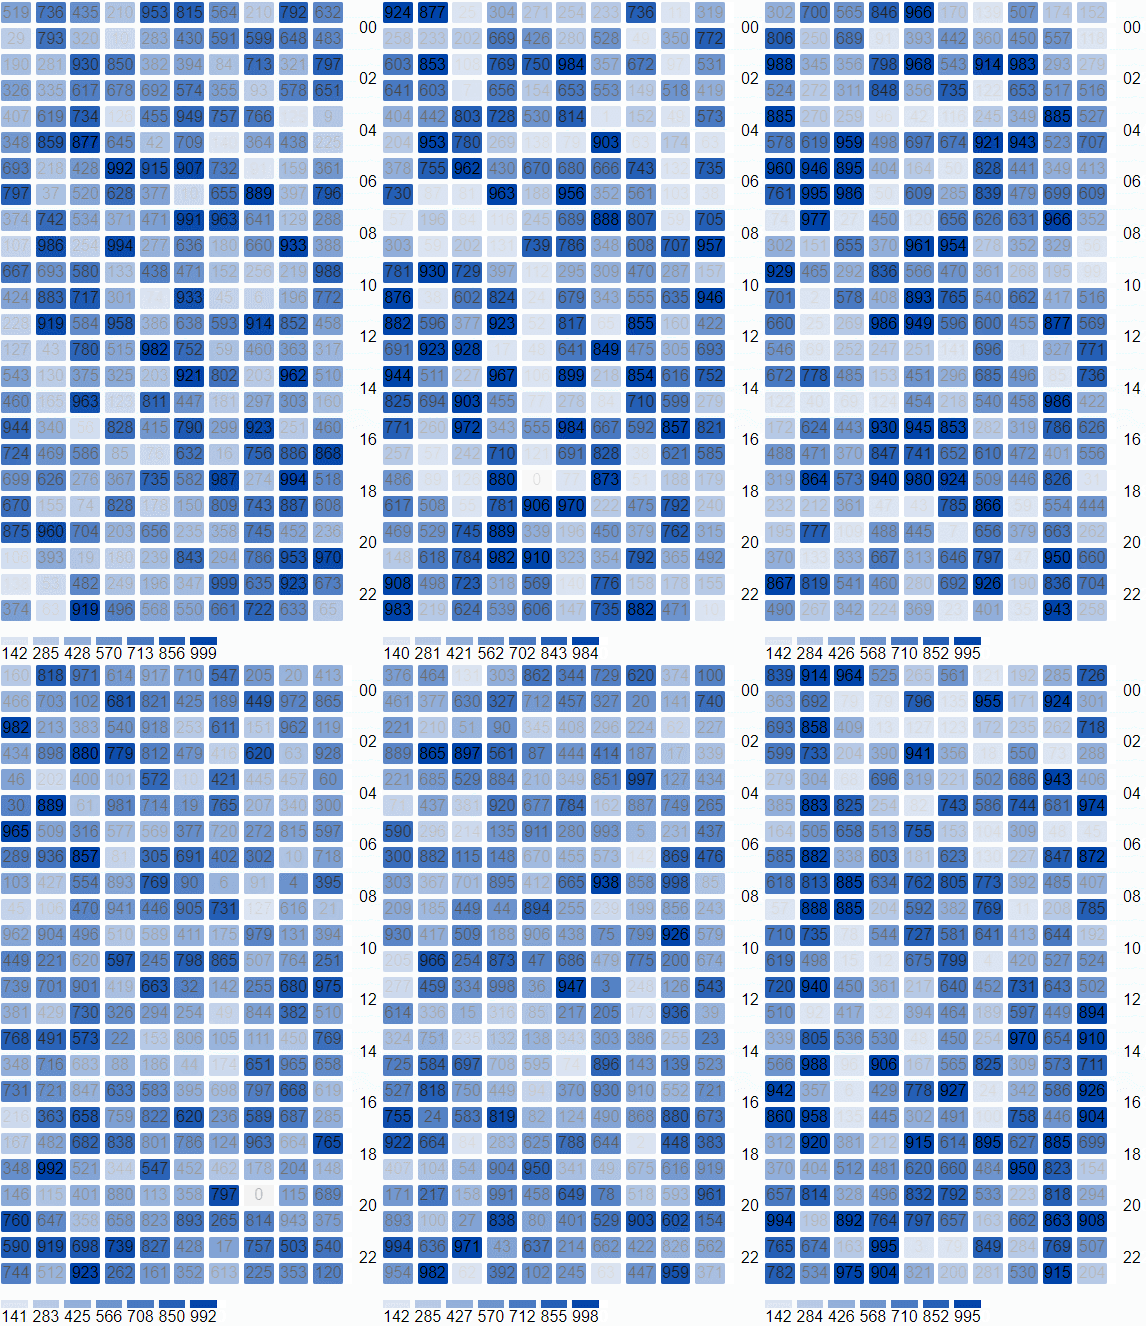
Shows count for every hour (use for debugging)
<TimeHeatMap timeEntries={entries} showCounts={true} />
Available options
| Option | Required | Description | Default value |
|---|---|---|---|
| timeEntries | yes | array of entries, needs to have 24 entries per day | [] |
| numberOfGroups | no | the number of groups to split the colours into | 4 |
| flow | no | allow the component to take the full width of its container | false |
| textForNoTimeEntries | no | custom text to show when there are no entries loaded | "No time entries" |
| showCounts | no | shows the counts for every hour, for testing | false |
| showGroups | no | shows the groups under the heat map | true |
| showHours | no | shows the hours | true |
Entries example, 7 days or 168 hours with counts between 0 and 1000 (image shortened)
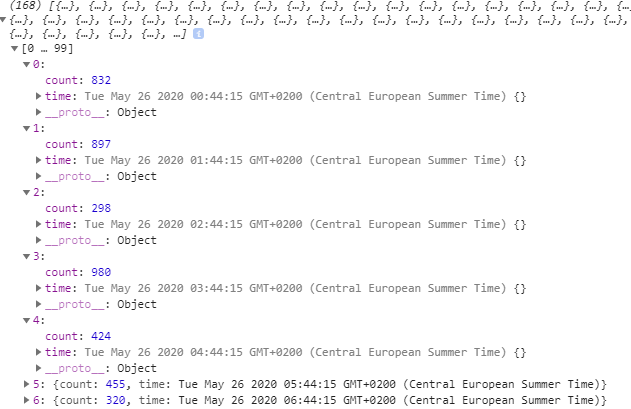
✔ hours, minutes or time zone are not relevant
✔ time needs to be a valid date
✔ the entries will be sorted by the component (left to right, past to present)
👏 typescript will make sure you type everything right
Examples
| Base example (7 days) | Custom nr. groups (10 days) | Show counts |
|---|---|---|
 |
 |
 |
Flow enabled, responsive
About
- made with React Hooks
- uses CSS Grid to create the arrangement
- styles applied with sass modules
- the animations in the images are just an example, the component will rerender only when new entries are passed
- support by any browser that supports grids (not IE)
Checkout more of me and my work at https://projectsbydan.com