README
An interactive Javascript Plotting Boilerplate
For plotting visual 2D data with Javascript on HTML canvas (in 2d-context) or SVG nodes.

This is a simple collection of useful functions, methods, classes, algorithms and concepts which I often use for the visualization of 2D geometries. Basic features are
- adding elements like
- configuration of the canvas behavior (fullsize, interaction, raster)
- mouse interaction (zoom, pan, drag elements)
- keyboard interaction
- touch interaction for dragging vertices (mobile devices: zoom, pan, drag elements)
The compressed library has 128kb.
Install the package via npm
   # Installs the package
   $ npm i plotboilerplate
The HTML file
For a full example see main-dist.html :
<canvas id="my-canvas"> Your browser does not support the canvas tag. </canvas>
The element canvas will be used to draw on.
The javascript
var pb = new PlotBoilerplate({
  canvas: document.getElementById("my-canvas"),
  fullSize: true
});
Alternative with SVG elements
Use SVG elements instead of canvas:
<svg id="my-svg"></svg>
And pass the SVG element:
var pb = new PlotBoilerplate({
  canvas: document.getElementById("my-svg"),
  fullSize: true
});
Add elements to your canvas
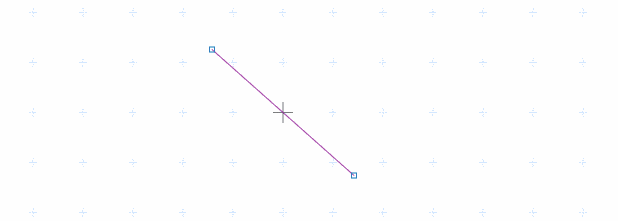
// Create two points:
//   The origin is at the visual center by default.
var pointA = new Vertex(-100, -100);
var pointB = new Vertex(100, 100);
pb.add(new Line(pointA, pointB));

// When point A is moved by the user
//   then move point B in the opposite direction
pointA.listeners.addDragListener(function (e) {
  pointB.sub(e.params.dragAmount);
  pb.redraw();
});

// and when point B is moved
//   then move point A
pointB.listeners.addDragListener(function (e) {
  pointA.sub(e.params.dragAmount);
  pb.redraw();
});
Typescript
// Usage with Typescript could look like this
import { PlotBoilerplate, Vertex, Line } from "plotboilerplate";

globalThis.addEventListener("load", () => {
  const pointA: Vertex = new Vertex(100, -100);
  const pointB: Vertex = new Vertex(-100, 100);
  console.log(pointA, pointB);

  const line: Line = new Line(pointA, pointB);

  const pb: PlotBoilerplate = new PlotBoilerplate({
    canvas: document.getElementById("my-canvas"),
    fullSize: true
  });

  pb.add(line);
});
A full working demo repository about the Usage with Typescript is here.
Screenshot

API
See API Documentation for details.
Screenshot

Examples and Demos
Initialization parameters
| Name | Type | Default | Description |
|---|---|---|---|
canvas |
HTMLCanvasElement | SVGElement | string | null |
The canvas or its query selector string (required). |
fullsize |
boolean | true |
If true, then the canvas will always claim tha max available screen size. |
fitToParent |
boolean | true |
If true, then the canvas will alway claim the max available parent container size. |
scaleX |
number | 1.0 |
The initial horizontal zoom. Default is 1.0. |
scaleY |
number | 1.0 |
The initial vertical zoom. Default is 1.0. |
offsetX |
number | 0.0 |
The initial offset. Default is 0.0. Note that autoAdjustOffset=true overrides these values. |
offsetY |
number | 0.0 |
The initial offset. Default is 0.0. Note that autoAdjustOffset=true overrides these values. |
drawGrid |
boolean | true |
Specifies if the raster should be drawn. |
rasterScaleX |
number | 1.0 |
Define the default horizontal raster scale. |
rasterScaleY |
number | 1.0 |
Define the default vertical raster scale. |
rasterGrid |
boolean | true |
If set to true the background grid will be drawn rastered. |
rasterAdjustFactor |
number | 2.0 |
The exponential limit for wrapping down the grid. (2.0 means: halve the grid each 2.0*n zoom step). |
drawOrigin |
boolean | false |
Draw a crosshair at (0,0). |
autoAdjustOffset |
boolean | true |
When set to true then the origin of the XY plane will be re-adjusted automatically (see the params offsetAdjust{X,Y}Percent for more). |
offsetAdjustXPercent |
number | 50 |
The x- and y- fallback position for the origin after resizing the canvas. |
offsetAdjustYPercent |
number | 50 |
The x- and y- fallback position for the origin after resizing the canvas. |
defaultCanvasWidth |
number | 1024 |
The canvas size fallback if no automatic resizing is switched on. |
defaultCanvasHeight |
number | 768 |
The canvas size fallback if no automatic resizing is switched on. |
canvasWidthFactor |
number | 1.0 |
Two scaling factors (width and height) upon the canvas size. In combination with cssScale{X,Y} this can be used to obtain sub pixel resolutions for retina displays. |
canvasHeightFactor |
number | 1.0 |
Two scaling factors (width and height) upon the canvas size. In combination with cssScale{X,Y} this can be used to obtain sub pixel resolutions for retina displays. |
cssScaleX |
number | 1.0 |
Visually resize the canvas using CSS transforms (scale x). |
cssScaleY |
number | 1.0 |
Visually resize the canvas using CSS transforms (scale y). |
cssUniformScale |
boolean | 1.0 |
If set to true only cssScaleX applies for both dimensions. |
autoDetectRetina |
boolean | true |
When set to true (default) the canvas will try to use the display's pixel ratio. |
backgroundColor |
string | #ffffff |
A background color (CSS string) for the canvas. |
redrawOnResize |
boolean | true |
Switch auto-redrawing on resize on/off (some applications might want to prevent automatic redrawing to avoid data loss from the drae buffer). |
drawBezierHandleLines |
boolean | true |
Indicates if Bézier curve handle points should be drawn. |
drawBezierHandlePoints |
boolean | true |
Indicates if Bézier curve handle points should be drawn. |
preClear |
function | null |
A callback function that will be triggered just before the draw function clears the canvas (before anything else was drawn). |
preDraw |
function | null |
A callback function that will be triggered just before the draw function starts. |
postDraw |
function | null |
A callback function that will be triggered right after the drawing process finished. |
enableMouse |
boolean | true |
Indicates if the application should handle touch events for you. |
enableTouch |
boolean | true |
Indicates if the application should handle touch events for you. |
enableKeys |
boolean | true |
Indicates if the application should handle key events for you. |
enableMouseWheel |
boolean | true |
Indicates if the application should handle mouse wheelevents for you. |
enableSVGExport |
boolean | true |
Indicates if the SVG export should be enabled (default is true). |
enableGL |
boolean | false |
[Experimental] Indicates if the application should use the experimental WebGL features. |
Example
var pb = new PlotBoilerplate({
  // HTMLCanvasElement | SVGElement | string
  //   Your canvas element in the DOM (required).
  canvas: document.getElementById("my-canvas"),

  // boolean
  //   If set to true the canvas will gain full window size.
  fullSize: true,

  // boolean
  //   If set to true the canvas will gain the size of its parent
  //   container.
  // @overrides fullSize
  fitToParent: true,

  // float
  //   The initial zoom. Default is 1.0.
  scaleX: 1.0,
  scaleY: 1.0,

  // float
  //   The initial offset. Default is 0.0. Note that autoAdjustOffset=true overrides these values.
  offsetX: 0.0,
  offsetY: 0.0,

  // Specifies if the raster should be drawn.
  drawGrid: true,

  // If set to true the background grid will be drawn rastered.
  rasterGrid: true,

  // float
  //    The exponential limit for wrapping down the grid.
  //    (2.0 means: halve the grid each 2.0*n zoom step).
  rasterAdjustFactor: 2.0,

  // Draw a crosshair at (0,0).
  drawOrigin: false,

  // boolean
  //   When set to true then the origin of the XY plane will
  //   be re-adjusted automatically (see the params
  //    offsetAdjust{X,Y}Percent for more).
  autoAdjustOffset: true,
  // float
  //   The x- and y- fallback position for the origin after
  //   resizing the canvas.
  offsetAdjustXPercent: 50,
  offsetAdjustYPercent: 50,

  // int
  //   The canvas size fallback if no automatic resizing
  //   is switched on.
  defaultCanvasWidth: 1024,
  defaultCanvasHeight: 768,

  // float
  //   Two scaling factors (width and height) upon the canvas size.
  //   In combination with cssScale{X,Y} this can be used to obtain
  //   sub pixel resolutions for retina displays.
  canvasWidthFactor: 1.0,
  canvasHeightFactor: 1.0,

  // float
  //   Visually resize the canvas using CSS transforms (scale).
  cssScaleX: 1.0,
  cssScaleY: 1.0,

  // boolean
  //   If set to true only cssScaleX applies for both dimensions.
  cssUniformScale: true,

  // boolean
  //   When set to true (default) the canvas will try to use the display's pixel ratio.
  autoDetectRetina: true,

  // string
  //   A background color (CSS string) for the canvas.
  backgroundColor: "#ffffff",

  // boolean
  //   Switch auto-redrawing on resize on/off (some applications
  //   might want to prevent automatic redrawing to avoid data
  //   loss from the drae buffer).
  redrawOnResize: true,

  // boolean
  //   Indicates if Bézier curve handles should be drawn (used for
  //   editors, no required in pure visualizations).
  drawBezierHandleLines: true,

  // boolean
  //   Indicates if Bézier curve handle points should be drawn.
  drawBezierHandlePoints: true,

  // function
  //   A callback function that will be triggered just before the
  //   draw function clears the canvas (before anything else was drawn).
  preClear: function () {
    console.log("before clearing the canvas on redraw.");
  },

  // function
  //   A callback function that will be triggered just before the
  //   draw function starts.
  preDraw: function (draw, fill) {
    console.log("after clearing and before drawing.");
  },

  // function
  //   A callback function that will be triggered right after the
  //   drawing process finished.
  postDraw: function (draw, fill) {
    console.log("after drawing.");
  },

  // boolean
  //   Indicates if the application should handle mouse events for you.

  enableMouse: true,
  // boolean
  //   Indicates if the application should handle touch events for you.
  enableTouch: true,

  // boolean
  //   Indicates if the application should handle key events for you.
  enableKeys: true,

  // boolean
  //   Indicates if the application should handle mouse wheelevents for you.
  enableMouseWheel: true,

  // Indicates if the SVG export should be enabled (default is true).
  enableSVGExport: true,

  // boolean
  //   Indicates if the application should use the experimental WebGL features.
  enableGL: false
});
Events
The Vertex class has basic drag event support:
var vert = new Vertex(100, 100);
vert.listeners.addDragListener(function (e) {
  // e is of type Event.
  // You are encouraged to use the values in the object e.params
  console.log("vertex was dragged by: ", "x=" + e.params.dragAmount.x, "y=" + e.params.dragAmount.y);
});
The e.params object
 {
  // The canvas that fired the event.
  element : [HTMLElement],

  // The event name.
  //   Default: 'drag'
  name : string,

  // The current drag position.
  pos : { x : number, y : number },

  // A mouse button indicator (if mouse event).
  //    0=left, 1=middle, 2=right
  button : number,

  // A flag indicating if event comes from left mouse button.
  leftButton : boolean,

  // A flag indicating if event comes from middle mouse button.
  middleButton : boolean,

  // A flag indicating if event comes from right mouse button.
  rightButton : boolean,

  // A mouse-down-position: position where the dragging
  //   started. This will not change during one drag process.
  mouseDownPos : { x : number, y : number },

  // The most recent drag position (position before
  //   current drag step).
  draggedFrom : { x : number, y : number },

  // True if this is a drag event (nothing else available the moment).
  wasDragged : boolean,

  // The x-y-amount of the current drag step.
  //   This is the difference between the recent drag step
  //   and the actual drag position.
  dragAmount : { x : number, y : number }
 }
| Name | Type | Example value | Description |
|---|---|---|---|
element |
HTMLCanvasElement | [HTMLCanvasElement] |
The canvas that fired the event. |
name |
string | drag |
The event name (default is 'drag'). |
pos |
position | { x : 20, y : 50 } |
The current drag position. |
button |
number | 0 |
A mouse button indicator (if mouse event). 0=left, 1=middle, 2=right |
leftButton |
boolean | true |
A flag indicating if event comes from left mouse button. |
middleButton |
boolean | false |
A flag indicating if event comes from middle mouse button. |
rightButton |
boolean | false |
A flag indicating if event comes from right mouse button. |
mouseDownPos |
position | { x : 0, y : 20 } |
A mouse-down-position: position where the dragging started. This will not change during one drag process. |
draggedFrom |
position | { x : 10, y : -5 } |
The most recent drag position (position before current drag step). |
wasDragged |
boolean | true |
True if this is a drag event (nothing else available at the moment). |
dragAmount |
position | { x : 100, y : 34 } |
The x-y-amount of the current drag step. This is the difference between the recent drag step and the actual drag position. |
Mouse, Keyboard and Touch interaction
- [SHIFT] + [Click] : Select/Deselect vertex
- [Y] + [Click]: Toggle Bézier auto-adjustment for clicked bézier path point
- [ALT or SPACE] + [Mousedown] + [Drag] : Pan the area
- [Mousewheel-up] : Zoom in
- [Mousewheel-down] : Zoom out
- Touch & move (1 finger): Move item
- Touch & move (2 fingers): Pan the area
- Touch & pinch: Zoom in/out
Build the package
Browsers support
IE / Edge |
Firefox |
Chrome |
iOS Safari |
|---|---|---|---|
| IE11 & Edge | latest | latest | latest |
Credits
- dat.gui by dataarts
- Neolitec's Color.js class
- FileSaver.js
- AlloyFinger.js
- Ray Casting Algorithm by Aaron Digulla
- Hobby Curves in Javascript by Prof. Dr. Edmund Weitz
- hobby.pdf
- jsHobby
- Blake Bowen's Catmull-Rom demo
- mbostock for the great convex-polygon-incircle implementation
- and for circle-tangent-to-three-lines
- Circle Intersection in C++ by Robert King
- The 'Circles and spheres' article by Paul Bourke
- shamansir/draw_svg.js for manipulating SVG path data strings
- opsb's stackoverflow proposal for converting ellipses sectors to SVG arcs.
- contrast-color-algorithm by Martin Sojka's
- Peter James Lu and Paul Steinhardt for their work on Girih patterns
- Cronholm144 for the Girih texture
- Mapbox's Earcut polygon algorithm
- Rosetta-Code for the Sutherland-Hodgman convex polygon clipping algorithm
- Jos de Jong for the very useful math.js library
- Jack Franklin for the howto-module-tutorial
- Narasinham for the very useful vertex-on-ellipse equations
- Tim Čas for the wrapMax/wrapMinMax functions
- Luc Maisonobe for the Ellipse to cubic Bézier math
- Dr. Martin von Gagern for the equidistant points on ellipse math
- Torben Jansen for the SVG-Arc to elliptic-sector conversion
- 3daddict for the js-stl-parser inspiration
- jburkardt for the obj test files.
- @veltman for the awesome geometric skeletonization article
Todos
Known bugs
- SVG resizing does not work in Firefox (aspect ratio is always kept, even if clip box changes). Please use PNGs until this is fixed.
- The BBTree.iterator() fails if the tree is empty! (Demos)
- The minifid BBTree and BBTreeCollection files do not export anything. The un-minified does. Why that?
- Arcs and ellipses break when non-uniform scaling (scalex!=scaley) is applied. Convert them to Bézier curves before drawing.
- Currently no more known. Please report bugs.


